Young Voters Turn on Trump, Disapprove of Big Beautiful Bill; Limited Evidence of Increasing ‘Manosphere’ Views or Male Loneliness Epidemic
Plus new data on 2028 primaries; prevalence of anti-Israel stances, antisemitic views in the electorate

Plus new data on 2028 primaries; prevalence of anti-Israel stances, antisemitic views in the electorate
The Yale Youth Poll, an undergraduate-led research project at Yale University, today released a new poll of young American registered voters (aged 18-34) and the general registered voter population. The poll sampled 3,426 registered voters, including 1,706 voters aged 18-34, allowing us to compare views across generations. Fielding was done by Verasight, and results were weighted for age, sex, race, education, and party identification. The survey was conducted in English, and the margin of error after weighting is ±1.7 percentage points for the full sample and ±2.4 percentage points for the youth sample.
Young voters now overwhelmingly disapprove of Trump’s job performance—a stark shift from what YYP found in our spring 2025 poll. Looking ahead to 2028, Gavin Newsom and JD Vance lead their respective presidential primaries—but a majority of Republicans would vote for Donald Trump in the GOP primary if he were able to run for a third term instead of the two allowed under the Constitution. A plurality of Democrats want their party to moderate ahead of 2028, while a majority of Republicans think the GOP needs to focus on turning out its base.
When asked whether men or women should take the lead on various roles in heterosexual relationships—such as making more money, handling household chores like cooking and cleaning, and providing childcare—voters mostly have gender egalitarian views. The youngest voters (aged 18-22) are slightly more likely than the overall electorate to express conservative views on gender roles. However, when asked whether they agree or disagree with several statements associated with the ‘manosphere’—such as “these days, men have it worse than women on average” or “traditional masculinity is under attack in society these days”—young voters’ views did not differ substantially from those of the overall electorate. Contrary to narratives about a ‘male loneliness epidemic,’ men and women roughly equally report having a friend they could count on in a difficult personal situations or to show up to a last minute social gathering, and young men and young women (meaning those 18-34) have roughly the same number of close friends, sexual partners, and opposite-sex friends, with no substantial divide between Democrats and Republicans.
Head-to-head testing of 48 messages from elected officials of both parties about the One Big Beautiful Bill Act (OBBBA) finds that Democrats’ messaging is more persuasive to voters than the GOP’s. The average Democratic message on OBBBA received 53% support in a MaxDiff test, compared to 47% for the average Republican message. Voters across all age groups believe that the law will mostly benefit billionaires and the wealthy; voters also think that the law will increase the national debt, prices they pay for everyday goods, and government spending.
Finally, our data finds that younger voters are much more likely to hold anti-Israel views than older voters and also much more likely to agree with antisemitic statements. Self-described “extremely conservative” young voters were the most likely to agree with at least one of the statements commonly considered to be antisemitic. We also investigated voters’ definitions of antisemitism with a range of situations. Among voters overall, 56% chose “not sure” when asked whether using the phrase “globalize the intifada” was antisemitic, and a plurality (47%) said calling the situation in Gaza a “genocide” was not antisemitic.
A key trend from this poll is reduced levels of support for President Trump and the Republican Party among young voters. In particular, we find that Harris won the 2024 votes of respondents aged 18-22, 23-29, and 30-34 by 3, 8, and 12 percentage points, respectively. However, these groups now disapprove of President Trump’s job as president by 30, 34, and 36 percentage points, respectively. This is a notable shift from our spring 2025 survey, which found that voters 18-21 narrowly approved of Trump’s job performance, while voters 22-29 narrowly disapproved.

Democrats enjoy substantial leads in the generic ballot among each of these groups as well, with leads of 15, 16, and 20 percentage points among 18-22 year-olds, 23-29 year-olds, and 30-34 year-olds, respectively. Republicans lead in the generic ballot by 7 points with 45-64 year-olds, and voters 65+ were tied.

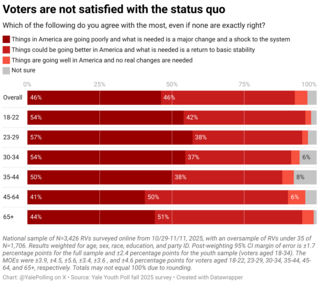
Voters are clearly not satisfied with the status quo, with just 4% of respondents believing that “no real changes are needed” in America, compared to 46% who want “a return to basic stability” and another 46% who would like “a major change and a shock to the system.” Young voters are especially likely to say that they favor a major change and a shock to the system. However, respondents remain split over which party represents change, with 29% choosing the Democratic Party, 29% choosing the Republican Party, 22% choosing neither, and 13% choosing both. Younger respondents are slightly more likely to consider the Democrats to be the party of change than older respondents.

Our poll finds that young people are generally more ideologically polarized than some of the older generations. While more young voters (including 47% of 18-22 year-olds and 45% of 23-29 year-olds) identify as liberal than in any of the older generations, the number of self-identifying conservatives (40% of 18-22 year-olds and 38% of 23-29 year-olds) is also substantial among the youngest generations.

Responses to an open-ended question–“Who do you think the Republican/Democratic party is fighting for?”–varied widely.
![[All respondents] “Who do you think the Republican Party is fighting for?”](/sites/default/files/styles/max_width_320/public/2025-12/gop_wc.png?itok=0rjpPxJG)
Voters see the Republican Party as focused on the wealthy: “rich,” “wealthy,” “billionaires,” “corporate,” “business,” “money,” and “donors” were all among top responses. People also think the GOP is fighting for the president himself, with “Trump” and “Donald” cited frequently. Terms with a nationalist or racial tone such as “citizens,” “country,” and “white” were also frequently mentioned.
![[All respondents] “Who do you think the Democratic Party is fighting for?”](/sites/default/files/styles/max_width_320/public/2025-12/dem_wc.png?itok=bqQvRoyo)
Democrats are seen as fighting for “immigrants” (often phrased with a negative connotation, using words like “illegal” and “alien”) and for “rights.” Other common words are “healthcare” and making things more “affordable” for the “middle” and “working class”—perhaps an indication that messaging from elected Democrats is breaking through to voters. However, there is also a perception that Democrats are carrying water for monied interests—“donors,” “corporate,” and “rich” are often mentioned—though this perception is weaker than it is for Republicans.
Results did not differ substantially when looking at only young voters, only young men, or only young women. The largest difference between the overall sample and voters under 35 was that the latter were more likely to say that Democrats are fighting for “rights” than mention “immigrants” or “illegal. Voters ages 18-34 produced the following word clouds:
![[Respondents aged 18-34 only] “Who do you think the Republican Party is fighting for?”](/sites/default/files/styles/max_width_320/public/2025-12/youth_gop_wc.png?itok=-b6WtfJr)
![[Respondents aged 18-34 only] “Who do you think the Democratic Party is fighting for?”](/sites/default/files/styles/max_width_320/public/2025-12/youth_dem_wc.png?itok=RjFS8m3R)
As part of our survey, we presented respondents with a random draw of two issues (out of 30 total options) and asked them which was more important when deciding their vote. Among voters overall, the top issues were “cost of living/affordability” (selected 88% of the time), “democracy” (78%), “Medicaid and Medicare” (73%), “corruption” (72%), and “election integrity” (72%). The lowest-ranked issues were “Ukraine and Russia (selected 33% of the time), “artificial intelligence” (27%), “acceptance of gay people” (27%), “Israel and Palestine” (25%), and “acceptance of transgender people” (18%)

The top issues for voters aged 18-34 were “cost of living/affordability” (91%), “democracy” (77%), “housing” (70%), “free speech” (67%), and “jobs” (67%); the lowest-priority issues were “Ukraine and Russia” (33%), “climate change” (29%), “artificial intelligence” (27%), “China” (25%), and “acceptance of transgender people” (23%).
Among self-identified Republican voters, 51% chose Vice President JD Vance as their preferred nominee for president in 2028, followed by Donald Trump Jr. (8%), Florida Governor Ron DeSantis (6%), former UN Ambassador Nikki Haley (5%), and Secretary of State Marco Rubio (5%). Vance leads by varying amounts across age and racial groups. Notably, among Republicans aged 18-22, Tucker Carlson comes in second at 13%, despite only winning 3% support overall.


In a MaxDiff test, Republicans viewed DeSantis (79%) and Vance (75%) as the most electable against a hypothetical Democrat in a general election, followed by Rubio (71%) and Trump Jr. (67%); results did not differ significantly between younger Republicans and all Republicans.

However, the picture changes when President Trump is included in a hypothetical 2028 Republican primary in which he is able to run. In this situation, Trump enjoys 50% support, followed by Vance at 19% and all others under 5%.

Interestingly, just 20% and 28% of respondents aged 18-22 and 23-29, respectively, would support Trump in a 2028 GOP primary, whereas a majority of respondents over 45 are willing to grant Trump an unconstitutional third term. In fact, Republican respondents aged 18-22 are the only age group where Vice President Vance leads President Trump (by 8 points). Among Republican respondents aged 23-29, President Trump only holds a 2-point lead over Vice President Vance, certainly within the margin of error. For Republicans aged 18-22, the candidate who wins the next most support after Trump and Vance is Tucker Carlson at 10%, substantially greater than his support in all other age categories. With a hypothetical Trump’s third term receiving lower support from younger age groups, our results show that younger Republicans are likely more skeptical of or less passionate about Trump than older Republicans.
On the Democratic side, California Governor Gavin Newsom leads the 2028 presidential primary with 25% support, followed by former Vice President Kamala Harris (18%), Representative Alexandria Ocasio-Cortez (16%), and former Secretary of Transportation Pete Buttigieg (14%). All other candidates received less than 5% support.

Unlike in the Republican primary, the Democratic candidates have larger variations in support between different demographic groups, suggesting that candidates have started to develop bases of support. For instance, Ocasio-Cortez leads among Democrats under 35 with 32%. Newsom leads among male (32%), white (27%), and Hispanic (27%) Democrats. Female (24%) and Black (47%) Democrats prefer Harris.

In a MaxDiff test, Democratic voters named Newsom as most electable against a hypothetical Republican candidate (85%). Arizona Senator Mark Kelly (63%), Minnesota Governor Tim Walz (59%), New Jersey Senator Cory Booker (58%), and Pennsylvania Governor Josh Shapiro (58%) were next in electability, despite polling relatively poorly in our horserace primary question. Interestingly, Mark Cuban was seen as the second-most electable Democrat (61%) among Democratic voters under 35, followed by Kentucky Governor Andy Beshear (59%).

A majority of Republican respondents (55%) believed that the GOP should focus on energizing and turning out their base in the next election, compared to 25% who thought their party should moderate to appeal to more voters and 20% who thought the party should keep the same strategy as 2024.


In contrast, 49% of Democrats believed that their party should moderate, while 45% wanted to prioritize turning out the base and just 6% thought the party should continue its 2024 strategy. This represents a noticeable shift from a similar question we asked in our spring poll, where 59% of Democrats said the party should move left and 39% said the party should move to the center.

A generational divide emerged here too. A majority of Democrats under 35 wanted their party to focus on energizing their base, while older Democrats tended to prefer moderation. Furthermore, whereas college-educated Democrats were relatively evenly split on this question, Democrats without a college degree more strongly supported moderation.

Prior to writing questions, the Yale Youth Poll team conducted a literature review of existing research on social capital. A full list of the questions we asked in this survey can be found here; motivations for each question can be found in Appendix B.
Voters are generally egalitarian in their descriptions of whether men or women should take the lead on various tasks in households with heterosexual relationships. Large majorities say that it doesn’t matter whether “the man” or “the woman” makes more money (78%), takes the lead on childcare (66%), makes the big financial decisions (83%), handles household chores like cooking and cleaning (80%), or asks the other person out on a first date (60%).

However, young voters reported slightly more traditional views in all of these categories except childcare. Whereas 37%, 19%, and 13% of respondents overall selected that “the man” should ask the other person out on a first date, make more money, and make the big financial decisions, respectively, those figures were somewhat higher among young voters—48%, 29%, and 23%, respectively, among 18-22 year-olds, and 41%, 25%, and 17%, respectively, among 23-29 year-olds. In terms of who should handle household chores like cooking and cleaning, 18-22 year-olds (23%) and 23-29 year-olds (18%) were only slightly more likely to say “the woman” than the sample overall (17%), and they were almost equally likely as the general sample to say that “the woman” should take the lead on childcare. In short, 18-22 year-olds were the most likely to report more traditional views of gender roles.

Still, young voters did not report substantially different views on hot-button gender debates. The vast majority (89%) of the overall sample supported equal pay for equal work. About half believed that traditional masculinity is under attack (53%) and that acceptance of transgender people has gone too far (48%). A third said that acceptance of gay people has gone too far (33%). Nearly identical proportions of 18-22 year-olds shared these opinions.

However, 18-22 year-olds and 23-29 year-olds were slightly more likely to say that men have it worse than women these days (24% overall, 28% for 18-22, 29% for 23-29) and that a woman’s place is in the home (13% overall, 18% for 18-22, 19% for 23-29), but still only a minority held those views.

Young men and young women generally align on contemporary issues of gender equality, such as agreement on equal pay for equal work. Notably, however, two discrepancies in young men’s perception of the social state appear. When asked if “traditional masculinity” was under attack, young men were 13 points more likely to agree with that statement than young women. Furthermore, when asked whether “men have it worse than women” these days, 39% of young male respondents agreed that men struggle more in today’s society, compared to just 14% of young women.

Respondents generally said that young men and young women face similar challenges, except in talking about emotions and mental health, with which 51% said young men struggle more. Majorities said that young men and young women struggle equally with making friends (62%), finding a romantic partner (60%), finding a sense of purpose in life (70%), and finding a good job (66%). However, respondents were more likely to say that young men struggled with making friends (21%), finding a romantic partner (21%), and finding a sense of purpose in life (17%) than young women (8%, 12%, and 7%, respectively). 17% of respondents said that young women have a harder time finding a good job, compared to 11% who said men do.

When it comes to talking about mental health, young voters were much more likely to say that young men have a harder time. 77% of 18-22 year-olds and 70% of 23-29 year-olds said that young men have more trouble talking about emotions and mental health, compared to 51% of the overall sample. Similarly, higher percentages of 18-22 year-olds and 23-29 year-olds said that young men struggle more than young women with making friends (32% and 32%), finding a romantic partner (41% and 35%), and finding a sense of purpose in life (27% and 30%), compared to 21%, 21%, and 17% of the general sample. These differences between younger voters and the overall sample appear to be largely driven by young men.

There was not a large difference between the shares of Democratic and Republican respondents saying that young men have a harder time with each of the items tested. However, Democratic respondents were slightly more likely to say that young men have a harder time talking about mental health and making friends, while Republican respondents were slightly more likely to say that young men have a harder time finding romantic partners, senses of purpose, and good jobs.

When it comes to young voters’ (18-34) experience of their social networks, men and women report roughly the same median numbers of close friends (4 for both young men and young women), close friends of the opposite sex (1 for both young men and young women), and lifetime sexual partners (also 4 for both young men and young women). The results do not differ significantly by party affiliation. These averages suggest that young men do not report themselves to be particularly lonely compared to young women.
In fact, most voters–including young, male, and female respondents–reported confidence in their support system of friends. Among the overall sample, vast majorities reported having a friend that would talk to them about a difficult personal situation (87%), drop off food when they’re sick (84%), help them move into a new apartment or house (82%), or come to a last-minute social event or hangout (72%).

On the romantic side, a plurality (45%) of voters aged 18-22 felt that they had less experience than their peers in reaching milestones in romantic relationships. However, 35%, 41%, and 47% of voters aged 18-22, 23-29, and 30-34, respectively, said they had average experience relative to their peers.

In sum, it seems that the “manosphere” and “tradwife” trends may have had some effect on young people’s attitudes towards gender roles or that these trends are downstream effects of pre-existing shifts toward traditionalist views on gender. However, although young voters appear to hold slightly more traditional views of gender roles, these differences are generally minor and do not extend to more overtly political issues, such as equal pay and LGBTQ+ acceptance.
Before writing questions about the One Big Beautiful Bill, the Yale Youth Poll team conducted a literature review of existing research on public opinion on tax and spending policy. A full list of the questions we asked in this survey can be found here; motivations for each question can be found in Appendix B.
When asked an open-ended question about which words come to mind when thinking of OBBBA, voters most often say two things: “Trump” and “tax.”
![[All respondents] “When you think of the One Big Beautiful Bill Act, what words come to mind?”](/sites/default/files/styles/max_width_320/public/2025-12/obbba_wc.png?itok=jSnF9WBi)
![[Respondents aged 18-34 only] “When you think of the One Big Beautiful Bill Act, what words come to mind?”](/sites/default/files/styles/max_width_320/public/2025-12/youth_obbba_wc.png?itok=Lx7eqvJW)
Other commonly selected words are “rich,” “cuts,” and “taxes,” along with a slew of negative words such as “stupid,” “bad,” “terrible,” “horrible,” “corruption,” “disgusting,” and “bullshit.”
When asked which groups would benefit most from OBBBA, 33% of voters overall said billionaires, followed by people making over $200,000 per year with 20%. Just 16% combined said the law would mostly benefit the middle class, working class, or the poor. These patterns were similar for voters under 30: a slightly larger share than the overall population said the law would mostly benefit billionaires (36%, 41%, and 41% among voters aged 18-22, 23-29, and 30-34, respectively) or people earning over $200,000 per year (20%, 21%, and 21%, respectively).

Across age groups, either a plurality or a majority think that the One Big Beautiful Bill will increase the national debt, the prices they pay for everyday goods, government spending, and their own taxes. Most voters do not think the law will create jobs.

When asked what effect OBBBA would have on their personal finances, 45% of voters overall said it would hurt their personal finances, while 20% said it would have no effect and just 18% said it would help. Across age groups, either a plurality or a majority said that the law would hurt their personal finances.

As part of our survey, we conducted a MaxDiff test of 48 different messages on OBBBA, drawn from real messaging used by elected officials in both parties. Respondents were asked the following question:
There is a lot of talk these days about the recently passed One Big Beautiful Bill Act. Which position do you agree with more?
Democrats say {randomize Dem message}. Republicans say {randomize GOP message}.
You can find an interactive table of all 48 messages here. We included partisan cues in the question (i.e., “Democrats say” and “Republicans say”) to simulate the real world where people hear these messages from partisan sources. In a MaxDiff test, if all messages were equally persuasive, each message would be selected 50% of the time it was displayed. On average, Democratic messages on OBBBA were selected 53% of the time, while on average Republican messages were picked 47% of the time. Voters ages 18-34 held more negative views of OBBBA, picking the Democratic message 60% of the time and the Republican message 39% of the time. Among the overall sample, the top testing messages—which were all from Democrats—were:
The top testing Republican messages were:
The overall takeaway: Voters clearly associate OBBBA with Donald Trump, and they generally don’t like what they’re seeing.
As part of our research process, before writing questions, the Yale Youth Poll team conducted a literature review of existing research on antisemitic attitudes so that we could identify gaps in the literature that our survey could fill, as well as re-examine similar questions in the context of 2025. The results of this review are summarized in the table below. A full list of the questions we asked in this survey can be found here; motivations for each question can be found in Appendix B.
Younger voters are more likely to hold antisemitic views than older voters. When asked whether Jewish people have had a positive, negative, or neutral impact on the United States, just 8% of voters overall said that they believed that Jews have had a negative impact. These numbers were higher among younger respondents: 18% of 18-22 year-olds said Jewish people have had a negative impact on the United States, as did 15% of 23-29 year-olds.

We also asked respondents whether they agreed or disagreed with the following three statements commonly considered to be antisemitic (drawn from a similar battery used in a series of papers by political scientists Eitan Hersh and Laura Royden):
Among all voters, 70% agreed with none of these three items. But the same is true for just 57% of 18-22 year-olds and 60% of 23-29 year-olds.

Looking at each of the items in the three-question battery individually, young voters are more likely to somewhat or strongly agree with each statement than older voters, with the youngest voters (18-22) being the most likely to agree with each. Among voters ages 18-22, 30% agreed with “Jews in the United States are more loyal to Israel than to America,” 21% agreed with “It’s appropriate to boycott Jewish American-owned businesses to protest the war in Gaza,” and 27% agreed with “Jews in the United States have too much power,” compared to 21%, 12%, and 16%, respectively, of voters overall.


These results may be picking up on similar trends as polling from Blue Rose Research, which found that a quarter of young people hold explicitly antisemitic attitudes (i.e., will say that they feel unfavorably towards Jewish people).
In our overall sample, smaller proportions of Black (62%), Asian (57%), and Hispanic (63%) respondents agreed with zero of the statements than white respondents (74%).

Among voters ages 18-34, the differences by race were narrower, with 65% of young white respondents, 57% of young Hispanic respondents, 54% of young Black respondents, and 60% of young Asian respondents disagreeing with all three statements. However, in line with Hersh and Royden’s findings, young white liberals were much more likely to disagree with all three statements (73%) than young white conservatives (55%).

Interestingly, for the overall sample, no clear partisan or ideological divides emerge in the total number of statements agreed with, but, among voters ages 18-34, self-identified “extremely conservative” voters are much more likely to agree with at least one statement (64%) than 18-34 voters in general (38%) or any other ideological subgroup of young voters. This gap is much larger than the margin of error for “extremely conservative” voters ages 18-34.


(Despite the overall sample’s lack of ideological divide in the total number of statements agreed with, each statement had a slightly different ideological distribution. For instance, self-identified “extremely liberal” voters were more likely to agree with “It’s appropriate to boycott Jewish American-owned businesses to protest the war in Gaza.” than the other ideological subgroups.)
Our poll found a large generational gap in how people define “Zionism.” We presented respondents with six different definitions of Zionism—drawn from groups ranging from the Anti-Defamation League and the American Jewish Council to Jewish Voice for Peace, the US Campaign for Palestinian Rights, and the Harvard College Palestine Solidarity Committee—and asked them to select the ones that match how they personally define the term. (A full list of definitions can be found in our survey instrument document; sources for each definition are in Appendix B.)

Among all voters, the most commonly selected definitions described Zionism as “self-determination and statehood for the Jewish people,” “the continued existence of Israel in the face of calls for its destruction,” and the Jewish people having an equal “right to statehood.” About a third of respondents simply reported that they were not familiar with the term “Zionism.”
However, younger voters were much more likely to select negative definitions: among voters ages 18-22, the most commonly selected definitions described Zionism as “maintaining a Jewish demographic majority in Palestine by driving out the native Palestinian population,” creating “a nation-state where Jews get more rights than others,” and “a form of racism and apartheid against Palestinians.”
Furthermore, 46% of respondents in the general sample believe that Israel should exist as a Jewish state, as opposed to existing as a non-Jewish state (18%) or not existing at all (5%). However, the picture is very different among younger populations. Specifically, 15% of respondents under 30 years old believe that Israel should not exist, and less than 30% believe that Israel should exist as a Jewish state. In contrast, 64% of respondents aged 65+ said that Israel should exist as a Jewish state.

Our poll also found a racial divide in the belief that Israel should exist as a Jewish state. In particular, Black (24%), Asian (30%), and Hispanic (36%) voters were less likely to say that Israel should exist as a Jewish state than white voters (51%). Black voters had an especially high proportion of respondents who said they were not sure of their opinion on this question (54%), compared to just 31% of the overall sample who said so.

In addition, young voters overwhelmingly support decreasing American military aid to Israel or ceasing aid entirely. Voters overall were split on the question of aid: 40% of respondents supported increasing or maintaining existing levels of military aid to Israel, while 43% favored either decreasing aid or stopping it entirely. But almost two-thirds of voters under 30 favored reducing or ending military aid to Israel, with a plurality—46%—favoring a total cutoff of aid.

The poll results also showed that self-identified Republicans, conservatives, and 2024 Trump voters were more likely to favor either increasing or maintaining the current level of military aid to Israel, while self-identified Democrats, liberals, and 2024 Harris voters were more likely to favor decreasing aid or stopping it entirely.
As part of this survey, we presented respondents with a series of hypothetical scenarios and asked whether they thought each one did or did not constitute antisemitism. We found a wide range of responses depending on the specific scenario. It is important to note that this question was designed to reveal what specific scenarios people think are or are not antisemitic; the goal is not to pass normative judgements on whether voters are choosing the “correct” answer. Notably, 56% of respondents chose “not sure” when asked whether using the phrase “globalize the intifada” counted as antisemitism. A plurality (47%) said calling the situation in Gaza a “genocide” was not antisemitic.

Different groups within the sample viewed the scenarios differently. For example, sometimes conservatives were more likely to label a scenario as antisemitic (especially the Israel-related scenarios), while other times liberals were more likely to do so (especially the scenarios related to the Jewish community in general, rather than to Israel). Still, one trend that emerged was that young voters were generally more limited in what they considered to be anti-Jewish prejudice, particularly in scenarios related to Israel.

Finally, we conducted an experiment to gauge whether voters perceived antisemitism, Islamophobia, and anti-Black racism similarly in the context of university speech policies. We split our sample into three groups, each of which was assigned randomly to one of these three test conditions. In each test condition, voters were asked who should get to decide what counts as antisemitism/Islamophobia/anti-Black racism when it comes to university policies (checking all that apply).
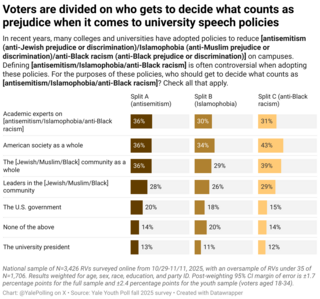
Responses were very split. Voters were more likely to say that the Jewish (36%) and Black (39%) communities as a whole should get to decide what counts as antisemitism and anti-Black racism, respectively, compared to the Muslim community as a whole getting to decide what counts as Islamophobia (29%). Respondents were also more likely to say that society as a whole should get to decide what counts as anti-Black racism (43%) compared to what counts as antisemitism (36%) or Islamophobia (34%).
The Yale Youth Poll surveyed an online sample of 3,426 registered voters from October 29 to November 11, 2025, with an under-35 oversample of 1,706. The survey was conducted in English, and its post-weighting 95% CI margin of error is ±1.7 percentage points for the full sample and ±2.4 percentage points for the youth sample; a full breakdown of MOE by demographic group can be found here. Full toplines and crosstabs can be found here. A full list of questions can be found here.
Fielding was done by Verasight, and results were weighted to ensure a sample that accurately reflects the American population. For the general population sample, results were weighted by age, race, education, sex, and party ID. For the under-35 sample, results were weighted by age, race, sex, and party ID. The demographics of the post-weighting sample for the general population can be found here. The crosstabs for all demographics display the weighted numbers and percentages.
The Yale Youth Poll is an undergraduate-led research organization. During the 2024-2025 academic year, the Yale Youth Poll received funding from the Democratic Innovations Program at Yale’s Institution for Social and Policy Studies. For the 2025-2026 academic year, the Yale Youth Poll has received funding from the Yale Program for the Study of Antisemitism and programmatic support from Yale’s Institution for Social and Policy Studies.
The Yale Youth Poll operates with complete editorial and methodological independence. All polling activities, including questionnaire development, data collection, analysis, and interpretation of results, are conducted entirely by the undergraduate students behind the Yale Youth Poll. The findings and conclusions presented on this website and on our Substack reflect solely the work and analysis of the Yale Youth Poll and do not constitute an official position of, nor are they endorsed by, the Democratic Innovations program, the ISPS, the Yale Program for the Study of Antisemitism, or Yale University.
Polling is our most powerful (albeit imperfect) tool for understanding public opinion. Democracy is about translating public opinion into policy. Politicians promise a better future for young people in the hopes of winning our votes. However, there is a relative scarcity of high-quality survey data on young voters’ opinions. Elected officials can’t represent young people’s interests without accurate data about what young people think. We provide unbiased, non-partisan data to guide policymakers, advocates, and journalists. In particular, we focus on comparing the opinions of young voters to the views of the electorate overall.
We would like to thank Professor Josh Kalla for his help getting this project off the ground and his feedback as we crafted this survey, along with Professor Linda Maizels and Professor Maurice Samuels. Any errors are our own.
MILAN SINGH is the Director of the Yale Youth Poll. He is a senior studying economics and can be reached at milan.singh@yale.edu. You can follow him on X @milansingh03.
JACK L. DOZIER is a Deputy Director for the Yale Youth Poll. He is a junior studying political science and can be reached at jack.dozier@yale.edu. You can follow him on X @JackLDozier.
KARLA CORTES is a Deputy Director for the Yale Youth Poll. She is a junior studying political science and history and can be reached at karla.cortes@yale.edu.
SOFIA BECK is the Head of Communications for the Yale Youth Poll. She is a sophomore studying political science and can be reached at sofia.beck@yale.edu.
DANIEL WANG is the Head of Data for the Yale Youth Poll. He is a junior studying statistics and data science and can be reached at daniel.wang.dyw8@yale.edu.
AHARON SHELEF is the Head of Research for the Yale Youth Poll. He is a freshman studying applied mathematics and political science and can be reached at aharon.shelef@yale.edu.
ARJUN WARRIOR is an Associate at the Yale Youth Poll. He is a senior studying history and can be reached at arjun.warrior@yale.edu.
JASON LAMPERT is an Associate at the Yale Youth Poll. He is a sophomore studying history and can be reached at jason.lampert@yale.edu. You can follow him on X @Jason_Lampert1.
JULIA CLAUSON is an Associate at the Yale Youth Poll. She is a freshman studying political science and can be reached at julia.clauson@yale.edu.
KATHLEEN DOYLE is an Associate at the Yale Youth Poll. She is a junior studying political science and can be reached at kathleen.doyle@yale.edu.
SONJA AIBEL is an Associate at the Yale Youth Poll. She is a sophomore studying data science and history and can be reached at sonja.aibel@yale.edu.
SOPHIE RICHARDSON is an Associate at the Yale Youth Poll. She is a junior studying statistics and data science and can be reached at sophie.richardson@yale.edu.
MICAH GOLD is an Associate at the Yale Youth Poll. He is a senior studying applied math and computer science and can be reached at micah.gold@yale.edu.
MATTHEW QUINTOS is an Associate at the Yale Youth Poll. He is a senior studying political science and can be reached at matthew.quintos@yale.edu. You can follow him on X @matthewquintos.
NICOLE MANNING is an Associate at the Yale Youth Poll. She is a junior studying political science and can be reached at nicole.manning@yale.edu.
ZACHARY DONNINI is a senior advisor to the Yale Youth Poll. He graduated from Yale in 2025 and is now a data science graduate student at Harvard University. He can be reached at zsdonnini@gmail.com. You can follow him on X @ZacharyDonnini.
Visit our website, subscribe to our Substack, and follow us on X for more information and regular polling updates. Questions can be directed to yyp.media@elilists.yale.edu.